





Why LTV/CAC and Net Revenue Retention Are Overtaking CAC Alone in Boardrooms
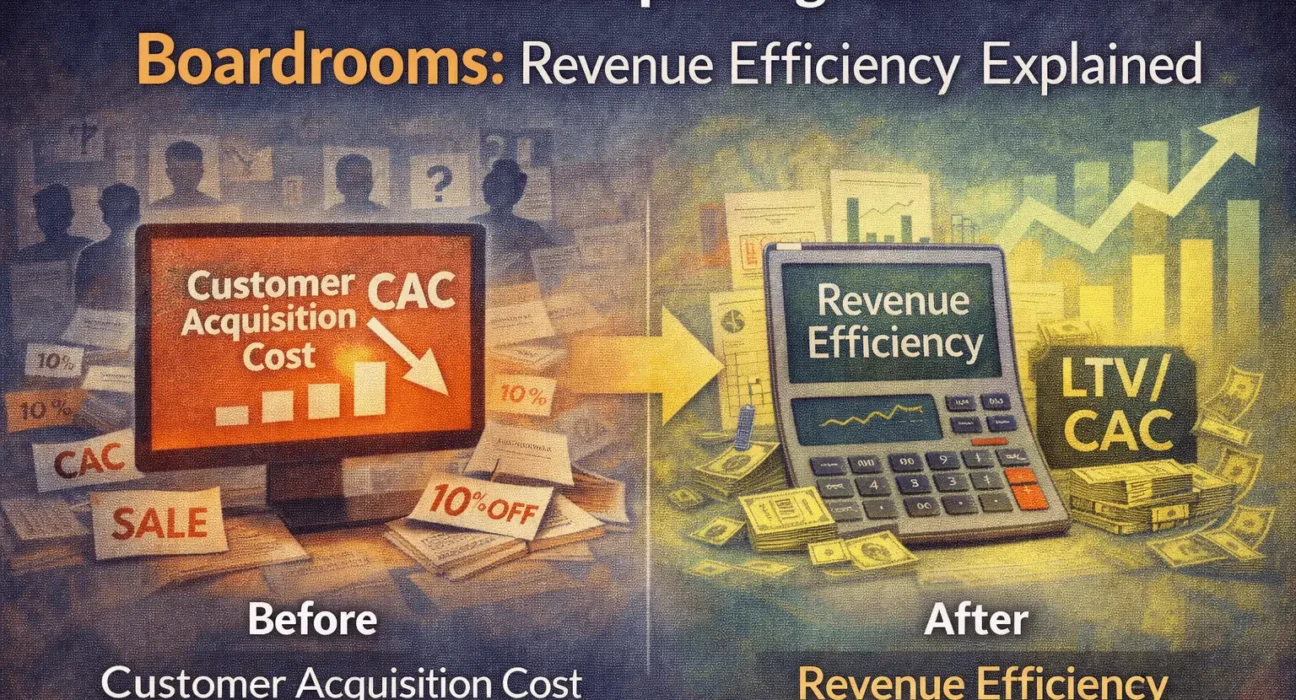
What metric is replacing CAC as the primary efficiency indicator in startup boardrooms?
A combination of the LTV/CAC ratio and Net Revenue Retention (NRR) — together, these answer a more complete question than CAC alone: not just what it cost to acquire a customer, but how much value that customer generates over time, and whether the existing customer base is expanding or shrinking. The industry-standard minimum for LTV/CAC is 3:1, with many investors in 2025 preferring 4:1 or higher. HubSpot’s own Q2 2025 results illustrate why boards increasingly look at more than acquisition cost: the company reported 103% Net Revenue Retention and an improved CAC payback period of 22.5 months (down from 24.9 months a year earlier) — but also disclosed its CLTV:CAC ratio remains below the ideal 3:1 benchmark, a nuance a single CAC number would never surface.
Why CAC Alone Was Always an Incomplete Signal
CAC answers a narrow question: how much did it cost to acquire this customer. It says nothing about whether that customer sticks around, expands their spend, or churns within a quarter. A company can have an excellent, low CAC and still be an unhealthy business if those cheaply-acquired customers don’t stay — which is precisely why boards have shifted toward metrics that combine acquisition cost with what happens after.
LTV/CAC: The Standard That’s Become Harder to Clear
The LTV/CAC ratio divides a customer’s lifetime value by what it cost to acquire them. According to benchmark research from SaaS Capital, the median healthy ratio sits around 3:1 — for every dollar spent on acquisition, a company generates roughly three dollars in customer lifetime value. That 3:1 figure has become the de facto minimum threshold for SaaS fundability, and many investors in 2025 push for 4:1 or higher given a more challenging capital environment. Ratios below 3:1 tend to signal unsustainable acquisition economics; ratios significantly above 5:1 can actually indicate underinvestment in growth, since capital that could be funding expansion is instead sitting idle.
Real companies illustrate the range: Slack disclosed in its S-1 filing before going public that it maintained net dollar retention above 140% — meaning its existing customers expanded spending by more than 40% annually, dramatically boosting the lifetime-value side of the ratio. Twilio has maintained an LTV/CAC ratio above 5:1 by prioritizing developer adoption and usage-driven growth over heavy paid acquisition.
Net Revenue Retention: The Metric That Reveals What Happens After the Sale
NRR measures revenue retained and expanded from existing customers over a period, independent of new customer acquisition entirely. A rate above 100% means expansion revenue (upsells, seat growth, cross-sell) is outpacing churn — the business is growing even before counting a single new customer. HubSpot’s 103% NRR in Q2 2025, driven by seat expansion and cross-sell growth across its Marketing, Sales, and Service Hub product lines, is a real, disclosed example of this dynamic in action, alongside the company’s $760.9 million in Q2 2025 revenue, up 19% year-on-year.
Why HubSpot Is a Genuinely Instructive Case, Not a Marketing Story
What makes HubSpot useful as an example isn’t a clean, uncomplicated success narrative — it’s the honesty of its own disclosed numbers. The company’s improving CAC payback period (22.5 months, down from 24.9) shows real progress on acquisition efficiency, and its 103% NRR shows existing customers are expanding. But its CLTV:CAC ratio remaining below the 3:1 ideal, according to analysis of its Q2 2025 results, shows the metric isn’t a vanity number that only ever improves — it’s a genuine diagnostic that can reveal work still in progress even at a large, established public company.
Why This Shift Is Happening Now
The push toward LTV/CAC and NRR over CAC alone tracks directly with the broader capital-efficiency shift covered elsewhere in this publication — as funding has tightened and investors have grown more selective, a metric that only measures acquisition cost, without measuring what that acquisition actually returns, no longer tells boards what they need to know to evaluate whether growth is durable.
How to Calculate These Without Overcomplicating It
LTV = Average Revenue Per Account × Gross Margin % ÷ Revenue Churn Rate. A common calculation error is using raw revenue instead of margin-adjusted revenue — if gross margin is 70%, a customer worth $100,000 in lifetime revenue only contributes $70,000 after accounting for delivery costs, and skipping that adjustment can inflate LTV by 30–50%, leading to overspending on acquisition based on an artificially strong ratio.
CAC should include the full cost of acquisition — marketing spend and sales team costs, including salaries and commissions, not just ad spend. For B2B SaaS companies with inside sales teams, sales costs often exceed marketing costs by 2–3x; excluding them from CAC produces an artificially favorable ratio.
NRR = (Starting Revenue + Expansion Revenue − Churned Revenue − Contraction Revenue) ÷ Starting Revenue, measured over a consistent period, typically annually or quarterly.
The Risk of Over-Indexing on These Metrics Too
Like any metric, LTV/CAC and NRR can be gamed or misread. A ratio significantly above the 4:1–5:1 range can indicate underinvestment in growth rather than genuine efficiency. And a company chasing only high-LTV enterprise accounts to inflate its ratio risks missing a much larger addressable SMB market that would grow the business faster in absolute terms, even at a lower per-customer ratio.
Frequently Asked Questions
1. What is considered a healthy LTV/CAC ratio for a SaaS company?
A healthy LTV/CAC ratio is generally 3:1 or higher. This benchmark indicates that the lifetime value (LTV) of a customer is at least three times the cost of acquiring them (CAC). Many investors also favor ratios of 4:1 or above, provided growth opportunities are still being pursued.
2. What does HubSpot’s Net Revenue Retention (NRR) rate tell us?
Net Revenue Retention measures how much recurring revenue existing customers generate over time. An NRR above 100% means expansion revenue from upgrades, additional seats, or cross-selling exceeds revenue lost from customer churn, allowing the business to grow even before acquiring new customers.
3. Is a very high LTV/CAC ratio always a good sign?
No. While strong unit economics are desirable, an exceptionally high LTV/CAC ratio may indicate that a company is investing too little in customer acquisition. If additional marketing and sales spend could profitably accelerate growth, an excessively conservative approach may limit long-term expansion.
4. What’s the most common mistake companies make when calculating LTV/CAC?
The most common mistakes are overstating customer lifetime value and understating acquisition costs. Companies should calculate LTV using contribution margin rather than revenue alone and include all relevant sales and marketing expenses—such as salaries, commissions, advertising, and software—in CAC calculations.
What to Watch Next
- Whether more public SaaS companies disclose granular LTV/CAC and NRR data, following HubSpot’s example, giving founders better real-world benchmarks
- Whether the “4:1 preferred” investor standard becomes more formalized as capital efficiency scrutiny continues across SaaS fundraising
- How AI-driven customer success and retention tools affect NRR trends industry-wide, potentially raising the baseline for what counts as a strong retention number
HubSpot figures cited above are drawn from the company’s Q2 2025 earnings analysis. LTV/CAC benchmark data is drawn from SaaS Capital’s benchmark research and Practicalwebtools’ 2025 SaaS metrics guide. Slack and Twilio figures are drawn from Slack’s S-1 filing and industry benchmarking research on SaaS growth metrics.
Summary

Article Name
The Metric Replacing CAC in Boardrooms: Revenue Efficiency Explained
DescriptionStartups are moving beyond CAC. Learn how revenue efficiency and LTV/CAC are becoming the real metrics driving boardroom decisions in 2025.
Author
Upstartzen Editorial Team
Publisher Name
Upstartzen


